
Indices

SOX Component Rebalancing 2026: Inclusion and Exclusion Candidates
Adrian Mitchell
The semiconductor industry rarely stands still, and neither does its best-known market benchmark. Changes to the PHLX Semiconductor Sector Index, commonly called SOX, offer a useful window into which companies are gaining market relevance, which are losing relative ground, and how investors price different parts of the chip supply chain.

Forward P/E vs. Forward Returns for Semi Indices: The Regression
Alexander Morgan
A semiconductor index trading at 18 times expected earnings looks cheaper than one trading at 30 times. That observation is easy. Deciding whether the cheaper index will deliver better future returns is considerably harder.

Semiconductor Index Seasonality: Q3 Strength, Q1 Weakness
Henry Cooper
The semiconductor calendar offers an appealing investment story. Consumer electronics production builds toward the holiday season, chip orders strengthen during the middle of the year, and first-quarter activity cools after the year-end rush. Translate that rhythm into an equity strategy, and the conclusion seems straightforward: favor semiconductor indices in Q3 and exercise caution in Q1.

CSI Semiconductor Index vs. STAR 50 Semi: The Style Divergence
Daniel Carter
Two portfolios can carry the semiconductor label and still express very different investment ideas. One may concentrate on the businesses that supply fabrication plants with equipment and materials. Another may lean toward chip designers, manufacturers, and technology companies whose valuations depend on expectations for future growth. When their returns diverge, the explanation often lies less in competing views of the semiconductor industry than in the exposures built into their construction.

Taiwan Semiconductor Index vs. SOX Correlation: The Decoupling Signal
Matthew Collins
Two semiconductor indices can follow the same global growth story and still tell different market stories. Taiwan’s semiconductor equities reflect the economics of manufacturing, design, packaging, and testing within a deeply connected production ecosystem. The Philadelphia Semiconductor Sector Index, better known as SOX, captures a different combination of semiconductor businesses through U.S.-listed securities. Their relationship offers a useful window into how investors price the chip cycle.

MSCI Korea Index Memory Duo Weight: Samsung and SK Hynix Dominance
Lucas Anderson
A country index sounds like a broad invitation: buy one basket and participate in an entire economy. The MSCI Korea Index offers something more distinctive. Its exposure to South Korea’s equity market is heavily shaped by Samsung Electronics and SK Hynix, two companies whose fortunes connect Korean stocks to the global demand for memory chips. For investors, that creates a compelling opportunity and a question that deserves careful attention: how much diversification does a country label actually provide?

Semi Index Dividend and Buyback Yield: The Total Return Decomposition
Matthew Foster
Semiconductor investing usually begins with technology: faster accelerators, denser memory, more advanced packaging, and the equipment needed to manufacture them. Yet the return delivered by a semiconductor index depends on something less glamorous as well: what companies do with the cash those technologies generate.
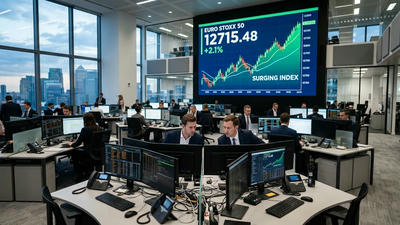
SOX Index at 12,715: The AI-Driven Re-Rating Trajectory
James Carter
At 12,715, the semiconductor index invites a bigger question than whether chip stocks have climbed too far: what kind of industry is the market now pricing? The traditional answer centers on inventories, manufacturing utilization, and periodic recoveries in electronics demand. The emerging answer puts computing infrastructure, scarce technical capabilities, and the economics of artificial intelligence closer to the center.

Nasdaq Global Semiconductor Index (GSOX) 1-Year Return: The 105% Surge
Kevin Foster
A semiconductor benchmark gaining 105% in one year is more than an impressive performance statistic. It signals a substantial change in how investors value the companies supplying the world’s computing infrastructure. Share prices are reflecting expectations about demand, profitability, competitive advantages, and the durability of investment in increasingly sophisticated chips.

Emerging vs. Developed Market Semi Indices: The Risk-Adjusted Return Gap
Daniel Walker
A semiconductor index can deliver a spectacular return and still be the less attractive investment. The missing pieces are the volatility endured, the drawdown survived, and the currency exposure carried along the way. Comparing emerging-market and developed-market semiconductor indicators therefore requires more than placing two performance charts side by side.

2027 SOX Target Price: The Sell-Side Divergence Summary
David Bennett
A 2027 target for the Philadelphia Semiconductor Index looks precise: one number, one horizon, one implied return. Underneath that number, however, sit several competing forecasts. How long can AI investment accelerate? When does memory supply catch demand? Will industrial chips recover? And what valuation will investors pay when those earnings finally arrive?

SOX vs. NDX Ratio: The Historic High and What It Means
Matthew Collins
When semiconductor stocks outperform the Nasdaq-100, the market is making a statement about where it expects growth, profits, and investment returns to concentrate. When that outperformance pushes the SOX-to-NDX ratio toward a historic high, the statement becomes harder to ignore. Chips are no longer simply participating in the technology rally; they are competing to become its defining economic engine.

The Impact of Rising Semi Weight in Hang Seng Tech Index on HK Market Dynamics
Ethan Richardson
The Hang Seng Tech Index has always been a useful lens on Hong Kong’s technology market, but in 2026 it is becoming something more interesting: a barometer for how much semiconductor exposure the city’s equity market is willing to absorb. As the semiconductor weight rises inside the index, the whole market dynamic changes with it. Suddenly, Hong Kong is not just a platform for internet and consumer tech names. It is becoming a more explicit proxy for AI hardware, chip supply chains, and the broader semiconductor cycle.

Risk-Adjusted Return Comparison of Emerging vs. Developed Market Semi Indices
Ryan Carter
When investors compare semiconductor indicators across regions, the first instinct is often to ask which market has delivered the higher return. That is only part of the story. A better question is which market has delivered the better return for the amount of risk taken. Once you look at semiconductors through that lens, the comparison between emerging and developed market semi indicators becomes much more interesting. It is no longer just a race between two groups of stocks. It becomes a study of volatility, drawdowns, cycle sensitivity, and how each market turns uncertainty into performance.

Impact of Semi Index Futures and Options Launch on Spot Volatility
Ryan Mitchell
Launching futures and options on a semiconductor index sounds, at first, like a technical market upgrade. In reality, it can change the behavior of the underlying spot market in meaningful ways. Once derivatives begin trading, the index is no longer just a benchmark for passive exposure or performance comparison. It becomes a reference point for hedging, speculation, arbitrage, and relative-value trading. That shift can affect liquidity, price discovery, and, most importantly, spot volatility.

Factor Exposure Analysis of Semi Indices: Momentum, Quality, and Value Factor Weights
Ethan Mercer
Semiconductor indices are often discussed as if they are pure technology barometers, but in practice they behave like factor portfolios in disguise. Their returns are shaped not only by chip demand, earnings cycles, and industry structure, but also by persistent style factors such as momentum, quality, and value. That makes factor exposure analysis a useful way to understand semi indicators. If you know which factor dominates a semiconductor index, you can better explain why it outperforms, underperforms, or suddenly rotates relative to the broader market.

Regression of Semi Index Forward P/E vs. Forward 12-Month Returns
Robert Carter
One of the most persistent questions in semiconductor investing is whether valuation really matters in the short to medium term. The sector is famous for cyclical swings, fast-rising expectations, and sharp reratings during AI and supply-constrained upcycles. That makes the relationship between forward P/E and forward 12-month returns especially interesting. A regression of semi index forward P/E against subsequent returns is not just an academic exercise. It is a practical way to test whether the market tends to reward or punish semiconductor valuations over the next year.

Practical Methods for Building Custom Semi Indices (Factor Tilts + Weight Optimization)
Kevin Foster
Building a custom semiconductor indicator is one of those ideas that sounds technical at first but becomes surprisingly intuitive once you break it down. The basic question is simple: instead of relying on a standard market-cap-weighted semiconductor index, what if you could design one that reflects the exact exposure you want? Maybe you want more AI design names, less foundry concentration, a stronger materials sleeve, or a better balance between growth and value. That is where factor tiles and weight optimization come in. Together, they offer a practical way to build a semi indicator that is not just representative, but intentional.

Tracking 5-Year Geographic Shifts of Global Leaders via the MSCI Semi Industry Index
Ethan Mercer
The semiconductor industry has never been more global, and yet at the same time, it has never been more geographically divided. Over the past five years, the center of gravity among global semiconductor leaders has shifted in noticeable ways, driven by AI demand, advanced packaging, supply chain security, regional industrial policy, and the growing importance of equipment and materials ecosystems. The MSCI Semi Industry Index offers a useful way to track these changes because it captures some of the world’s most important semiconductor and semiconductor equipment leaders across developed markets. Looking at its five-year evolution is therefore not just an index exercise. It is a way to understand how the global semiconductor map has been redrawn.

Compilation Differences and Tracking Choices Between CSI All-Share Semi and CES Semi Indices
Daniel Morgan
When investors compare China’s semiconductor indicators, the first instinct is often to ask which one is “better.” But that question is usually too simple. A more useful question is: what exactly is each index trying to capture, how is it built, and what does that mean for tracking choice? The CSI All Share Semi indicator and the CES Semi indicator may seem to point at the same industry, but they can behave quite differently because of the way they are compiled, weighted, and rebalanced. Those differences matter, especially for investors who want semiconductor exposure that is either broader, purer, more liquid, or more representative of the domestic ecosystem.

SOX Index Major Component Overhaul in 2026: Inclusion and Exclusion Predictions
Thomas Walker
The SOX index has always been more than a stock market ticker. It is a shorthand for where the semiconductor industry is investing, where the market believes growth will come from, and which companies are viewed as essential to the next cycle of digital infrastructure. In 2026, that importance is even more pronounced because semiconductors are no longer just a technology sector. They are an AI, data center, advanced packaging, and supply chain story all at once. That makes the composition of the SOX index unusually consequential.

Industry Reclassification of SOX: Shifting Weights of Equipment/Materials/Design/Manufacturing
Lucas Anderson
The SOX index has always been more than a simple list of semiconductor stocks. It is a lens through which investors view the structure of the industry itself. When that lens changes, the market narrative changes with it. Industry reclassification inside SOX is not just a technical adjustment; it is a statement about what the semiconductor sector is becoming. If equipment, materials, design, and manufacturing are being weighted differently, then the index is no longer describing the same industry in the same way. It is telling a new story.

The Risk of Index Weight Concentration: The Case of Nvidia’s Overweight in SOX
James Carter
Index concentration is one of those market issues that sounds technical until it suddenly becomes very real. In the semiconductor world, it is not hard to see why. A handful of companies have become so large and so influential that they can dominate the behavior of an entire index. Nvidia’s overweight in SOX is the clearest example. It reflects the extraordinary success of one company, but it also raises an uncomfortable question: when one name becomes too large, is the index still a true sector barometer or is it increasingly a single-stock proxy in disguise?

Seasonality in Semi Indices: Historical Data Shows Q3 Strongest, Q1 Weakest
Robert Carter
Semiconductors are often treated as a pure growth story, driven by AI demand, product cycles, foundry utilization, and capital expenditure. But if you zoom out and look at the data over time, a quieter pattern appears: seasonality. Historical semiconductor indicators often show that the third quarter tends to be the strongest period, while the first quarter tends to be the weakest. That may sound like a simple calendar effect, but in practice it can shape inventory flows, earnings expectations, index performance, and even investor sentiment around the sector.

The Small-Cap Effect in Semi Indices – Where Does the Alpha Come From?
Daniel Walker
Semiconductor indices are often discussed as if the real action sits entirely with the mega-caps. The biggest AI leaders, the dominant foundries, the top memory names, and the most visible equipment companies usually get the spotlight. But if you look more carefully, there is another layer of return behavior that can be surprisingly important: the small cap effect. In semiconductor indicators, smaller companies sometimes generate a disproportionate share of alpha, especially when the market broadens beyond the headline leaders or when the cycle starts to move from pure momentum into selective recovery.

Total Return Analysis of Semi Indices: Dividend Yield + Buyback Yield
Daniel Carter
When investors talk about semiconductor indices, the conversation usually leans toward growth, innovation, and valuation. That makes sense. Semiconductors are one of the market’s most forward-looking sectors, and their returns are often tied to expectations rather than current income. But there is another angle that is easy to overlook: total return. If you only focus on price moves, you miss the cash that companies return to shareholders through dividends and buybacks. In a sector where capital allocation is becoming more disciplined, dividend yield plus buyback yield can add an important layer of insight.

A Summary of Major Banks’ 2027 SOX Index Target Price Divergence
Michael Evans
When major banks publish different 2027 target prices for the SOX index, the disagreement is rarely just about arithmetic. It usually reflects a deeper split in how they view semiconductor earnings, valuation, AI demand, memory cycles, and the durability of the current capex boom. In 2026, that divergence has become especially noticeable because semiconductors are sitting at the center of multiple market narratives at once: AI infrastructure, advanced packaging, HBM, foundry capacity, and the broader rotation between growth and cyclical leadership.

Alert Signals from Historical Percentiles of Semi Index Relative Valuations
Daniel Carter
Relative valuation is one of the most powerful but also one of the most misunderstood tools in semiconductor investing. When the semiconductor index looks expensive relative to the broader market, the natural instinct is to call a top. When it looks cheap, the instinct is to call a bottom. But history is more complicated than that. Perceptions of semi index relative valuation have often sent mixed signals, and the alerts they produce are only useful if they are read in context rather than treated as automatic buy or sell triggers.

A Practical Guide to Rebalancing Arbitrage Using Quarterly Component Weight Adjustments
Lucas Anderson
Rebalancing arbitrage is one of those market strategies that sounds more complicated than it often is. At its core, it is about anticipating the mechanical trading that happens when an index changes its component weights. In semiconductor indexes, where a few large names can dominate performance and quarterly adjustments can be material, those rebalancing flows can create real opportunities for traders who understand how the process works.

Equal-Weight vs. Cap-Weighted – Which Performs Better in Semi Indices?
Daniel Carter
The debate between equal weight and cap weighted semiconductor indexes is more than a portfolio construction question. It is really a question about what kind of semiconductor story you want to tell. A cap weighted index highlights the sector’s largest winners and gives more influence to the names that have already created the most value. An equal weight index gives each constituent the same voice, which often produces a more balanced and sometimes more contrarian picture. In a sector as dynamic as semiconductors, the difference can be dramatic.

Valuation Discount/Premium Analysis of Korea’s KOSPI Semi Index vs. SOX
Ryan Mitchell
Valuation comparisons between semiconductor markets are always a little tricky, but the KOSPI semiconductor index versus SOX is one of the most interesting cases to study. On the surface, both indexes represent major players in the global chip industry. In practice, they often trade at different valuation levels because they sit in different market structures, reflect different investor bases, and carry different expectations about growth, governance, and risk. That is why the question of discount or premium is not just academic. It speaks to how the market is pricing Korea’s semiconductor leadership relative to the U.S. semiconductor complex.

Attribution of Long-Term Return Differences Between STOXX Europe Semi and US Semi Indices
Lucas Bennett
The long-term return gap between STOXX Europe semiconductor indicators and U.S. semiconductor indicators is one of the most interesting comparisons in global equity analysis. At first glance, it looks like a simple question of performance: which region did better over time? But the deeper answer is much more layered. Return differences are not just about geography. They are about index composition, valuation starting points, currency effects, industrial structure, innovation leadership, market concentration, and the specific role each region plays in the semiconductor value chain.

Comprehensive Style Comparison Between CSI Semi Index and STAR 50 Semi Index
Robert Carter
China’s semiconductor market has become one of the most closely watched technology arenas in the world, and two indexes often used to track it are the CSI Semi Index and the STAR 50 Semi Index. At first glance, they may seem to tell the same story: both are linked to chips, innovation, and the rise of domestic semiconductor capability. But once you look more carefully, the two indexes have very different styles, different exposures, and different roles in how investors read the market. That difference matters because style is not just a technical detail. It shapes performance, volatility, and the kind of semiconductor story each index actually tells.

SOX/NDX Ratio Hits All-Time High – Trend Continuation or Reversal?
Marcus Reed
When the SOX/NDX ratio hits an all-time high, the market is making a statement. It is saying that semiconductors are not just participating in the broader tech rally; they are leading it decisively. But whenever a relative-strength ratio reaches an extreme, the next question is never far away: is this the start of a longer trend extension, or the kind of climax that often precedes a reversal?

Semi Industry’s Contribution to S&P 500 Earnings Breaks 12% for the First Time
Robert Mitchell
The semiconductor industry has quietly moved from being one of many growth sectors in the S&P 500 to becoming one of the index’s most important earnings engines. For the first time, its contribution to S&P 500 earnings has broken the 12% mark, and that is more than a statistical milestone. It is a signal that semiconductors are now central to the health of the broader U.S. equity market. What used to be a cyclical, specialized industry has become a structural driver of index-level profit growth.

Taiwan Semi Index vs. SOX Correlation Drops to 5-Year Low – A Decoupling Signal
Marcus Reed
When the Taiwan semiconductor index and SOX stop moving in lockstep, the market tends to notice. A five-year low in correlation is not just a statistical oddity; it is a signal that something important is changing in the structure of semiconductor leadership. For years, investors have treated Taiwan’s semiconductor market and the Philadelphia Semiconductor Index as close cousins, often using one as a read-through for the other. When that relationship weakens sharply, it forces a rethink. Is the divergence temporary noise, or is it telling us that the semiconductor cycle itself is fragmenting?

Asymmetric Correlation Study Between Semi Indices and Crude Oil Prices
Daniel Brooks
Semiconductors and crude oil do not look like obvious relatives. One is associated with AI chips, advanced packaging, foundries, and global technology supply chains. The other is tied to energy markets, geopolitics, transportation, and inflation. Yet when investors study market correlations closely, the relationship between semi indicators and crude oil prices becomes surprisingly interesting. It is not just whether the two move together. It is whether they move together differently when oil rises versus when oil falls. That asymmetry is where the real signal often lives.

Quantitative Management of Intraday Volatility and Overnight Gap Risks in Semi Indices
Jonathan Mercer
Semiconductor indices can move like a calm river for hours and then turn into rapids in a matter of minutes. That is part of their appeal and part of their challenge. If you trade or manage exposure to semi indicators, you quickly learn that not all risk lives in the same place. Some of it shows up during the trading session as intraday volatility. Some of it arrives when the market is closed, in the form of overnight gaps. Managing both well requires more than intuition. It calls for a quantitative framework that can separate the two, measure them properly, and respond with discipline rather than emotion.

A 10-Year Backtest of the Forecasting Accuracy of the WSTS Global Semi Benchmark Index
Marcus Reed
Forecasting semiconductor markets is never easy, and that is exactly why benchmark indices and consensus forecasts matter so much. The WSTS Global Semi Benchmark Index is widely treated as a reference point for the industry’s direction, but how accurate is it over time? A 10-year backtest is a useful way to answer that question because it separates habit from evidence. It shows where the benchmark tends to be strong, where it tends to miss, and how much confidence investors and strategists should place in it during different phases of the cycle.

Compilation Flaws of China’s Semi Indices vs. SOX and Improvement Pathways
Ryan Mitchell
China’s semiconductor market has become far more important in global technology investing than it was a decade ago, but the quality of its market indicators has not always kept pace with that importance. When investors compare China’s semiconductor indices with the SOX, the differences are often less about performance alone and more about how the benchmarks are constructed. That is where compilation flaws become visible. A semiconductor index is only as good as the logic behind its constituent selection, weighting, rebalancing, and sector definition. If the methodology is weak or inconsistent, the index can misrepresent the industry it is trying to track.

Sources of Alpha in Semi Index Enhanced Products – A Multi-Factor Decomposition
Ryan Mitchell
Semiconductor index enhanced products occupy a fascinating middle ground between passive exposure and active conviction. They are not meant to stray far from the benchmark, but they are designed to do a little better than the benchmark. That “little better” is where the real story lies. In a sector as dynamic as semiconductors, alpha can come from many places at once: factor tilts, stock selection, timing, supply-chain themes, and structural shifts such as AI, advanced packaging, and memory cycles. The challenge is to understand which of those sources truly contribute to excess return and which simply look good in hindsight.

Arbitrage Strategies During Index Rebalance Windows: Empirical Alpha Based on Inclusion Expectations
James Wilson
Index rebalance windows create a very particular kind of market opportunity. They are short, predictable, and often driven by mechanical flows rather than fundamental reassessment. For traders who understand how index construction works, those windows can produce a repeatable source of alpha, especially when inclusion or exclusion expectations begin to build before the actual rebalance date. The result is a game of anticipation, positioning, and timing, where the market often prices in the rebalance before it officially happens.